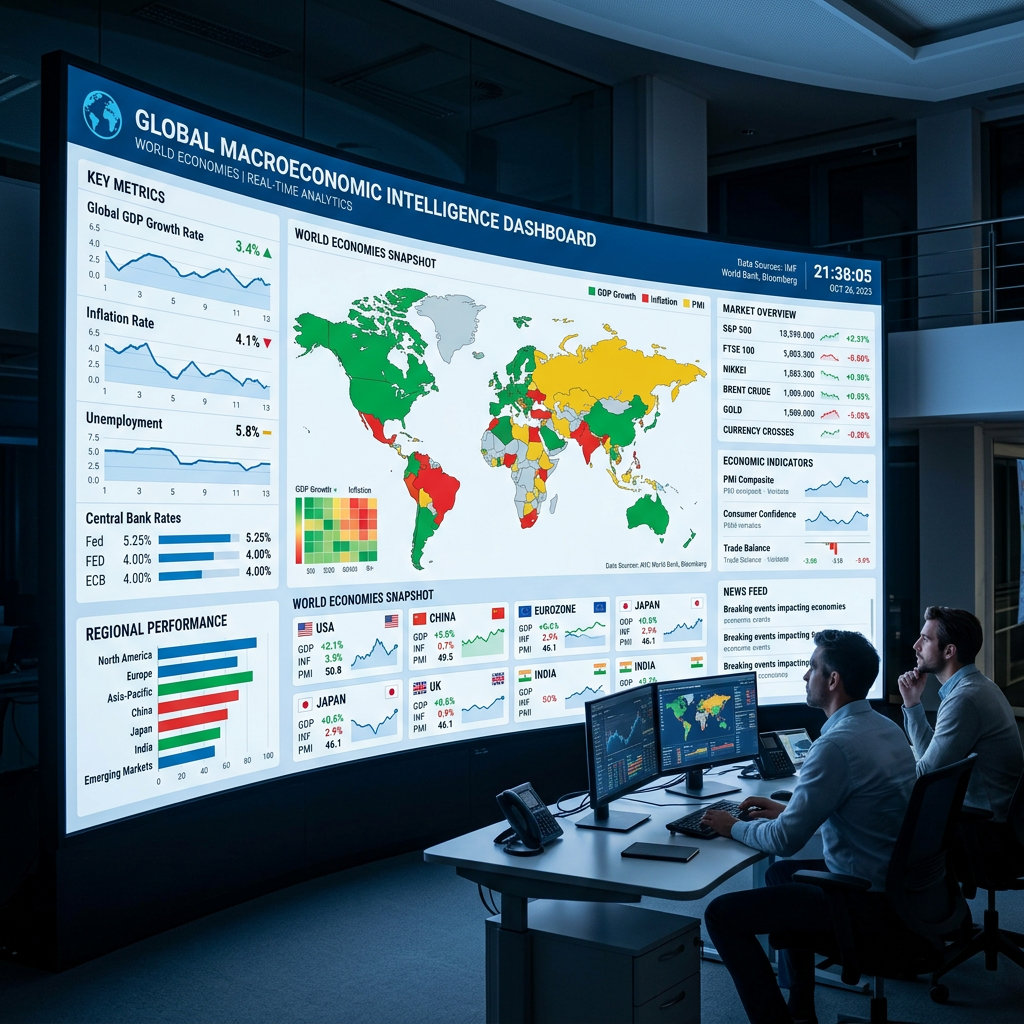
Global Macro Outlook AI is an interactive macroeconomic intelligence dashboard designed for research, education, and decision-support. The platform provides a structured view of global macroeconomic conditions across major economies, including the United States, Canada, the Euro Area, China, Japan, the United Kingdom, Germany, India, Brazil, and Mexico.
The dashboard brings together country-level macro profiles, risk scores, regime classifications, inflation indicators, central bank policy signals, fiscal risk measures, credit-cycle conditions, external vulnerability indicators, commodity and energy trends, forecasting tools, AI-style country outlook reports, data-source transparency, and methodology notes.
Each country profile is designed to summarize key macroeconomic and financial conditions, including GDP growth, inflation, labour-market indicators, fiscal balances, debt dynamics, external balances, credit conditions, and market-related signals. The global dashboard provides a comparative overview of country risk and macro regimes, helping users quickly identify expansionary conditions, disinflationary growth, fiscal stress, or other macro-financial patterns.
The inflation tracker focuses on headline inflation, wage pressure, oil and food prices, exchange-rate effects, and inflation persistence. The central bank monitor reviews policy rates, real interest rates, yield-curve conditions, and rule-based signals of hawkish or dovish policy stance. The fiscal monitor evaluates debt, deficits, rate-growth dynamics, and sovereign stress indicators. The credit-cycle section tracks credit growth, banking stress, non-performing loan proxies, yield-curve inversion, and broader financial vulnerabilities. The commodity tracker highlights energy, metals, food-price proxies, and inflation pass-through risks.
The forecasting lab and AI country report sections are designed to support scenario thinking and structured macroeconomic interpretation. Where live API connections are available, the platform can display live data. Where live data are unavailable, the system clearly labels demo or fallback data so users can distinguish between illustrative values and live-source outputs.
This project is an MVP, or minimum viable product, developed as a prototype for macroeconomic monitoring, forecasting design, data transparency, and AI-assisted economic reporting. It is intended for academic, teaching, research, and professional demonstration purposes. Forecasts, classifications, and risk scores are not investment, legal, tax, or financial advice.
Main Dashboard Indicators
Average Macro Risk Score
This score summarizes overall macroeconomic risk across the covered countries. It combines several risk dimensions, including growth, inflation, monetary conditions, fiscal stress, credit stress, and external vulnerability.
Country Risk Heatmap
The heatmap compares country-level macro risk scores across the covered economies. It helps users quickly identify which countries are in low-risk, watch, elevated, high-risk, or stress conditions.
Macro Regime Classification
Each country is classified into a macroeconomic regime, such as expansion, slowdown, recession risk, stagflation, disinflationary growth, fiscal stress, credit stress, or external stress. The regime label provides a quick interpretation of current macro conditions.
Regime Mix
This indicator summarizes how many countries fall into each macro regime. It gives a quick global view of whether the sample is mostly expanding, slowing, disinflating, or facing stress.
Country Macro Profile Indicators
Real GDP Growth
Measures the pace of economic activity and growth momentum. Weakening GDP growth increases growth-risk pressure, while stable or positive growth supports expansionary conditions.
Inflation / CPI
Tracks consumer price inflation and price-pressure conditions. Higher or rising inflation contributes to inflation-risk scoring.
Unemployment
Represents labour-market slack and employment conditions. Rising unemployment can signal weakening demand, recession risk, or labour-market stress.
Wage Growth
Captures labour-cost pressure and potential inflation persistence. Higher wage growth may support household income, but it may also add to inflationary pressure.
Policy Rate
Shows the central bank’s short-term interest-rate stance. A high policy rate can indicate restrictive monetary policy, especially when inflation is easing.
Real Policy Rate
Calculated as the policy rate minus inflation. A positive and rising real policy rate suggests tighter monetary conditions.
10-Year Government Yield
Represents long-term borrowing costs and market expectations about growth, inflation, and monetary policy.
Yield-Curve Slope
Measures the relationship between long-term yields and short-term policy rates. A negative slope, or inversion, may signal tighter financial conditions or recession risk.
Fiscal Balance
Shows the government budget position as a share of GDP. Large deficits can increase fiscal stress, especially when borrowing costs are high.
Debt-to-GDP Ratio
Measures public debt relative to the size of the economy. Higher and rising debt ratios can increase sovereign-risk pressure.
Nominal GDP Growth
Combines real growth and inflation. It matters for debt sustainability because stronger nominal growth can make debt burdens easier to manage.
Debt Dynamics / r-g Arithmetic
Compares interest-rate pressure with nominal growth. When interest rates exceed growth, debt sustainability risk can rise.
Current Account Balance
Measures the country’s external balance with the rest of the world. Large current-account deficits may increase external vulnerability.
FX Versus USD
Tracks exchange-rate pressure relative to the U.S. dollar. Depreciation can increase import costs, inflation pressure, and external vulnerability.
Foreign Exchange Reserves
Represents the country’s buffer against external shocks. Strong reserves can reduce external-risk pressure.
External Debt
Measures exposure to foreign borrowing and external financing risk. Higher external debt can increase vulnerability when global rates rise or currencies depreciate.
Credit Growth
Tracks the pace of private-sector credit expansion. Rapid, unstable, or sharply slowing credit growth can signal credit-cycle risk.
Non-Performing Loan Ratio
Measures banking-sector asset-quality risk. Rising NPLs may indicate financial stress, borrower weakness, or deteriorating credit conditions.
Credit Stress Score
A rule-based indicator that summarizes credit-cycle vulnerability using credit growth, NPL proxies, and yield-curve signals.
Inflation Tracker Indicators
Headline CPI Inflation
The core inflation-monitoring indicator. It shows the latest consumer price inflation rate and contributes to the inflation-risk score.
Inflation Pressure Score
A rule-based score that combines CPI, wages, commodity prices, exchange-rate pressure, and persistence signals.
Oil Price
Captures energy-cost pressure. Rising oil prices can feed into transportation, production costs, and headline inflation.
Natural Gas Index
Tracks energy-market pressure beyond crude oil. Gas-price movements can affect utilities, industrial production, and household energy costs.
Food Price Proxy
Measures food-related commodity pressure. Food shocks can strongly affect headline inflation and household purchasing power.
FX Depreciation Signal
Captures currency-driven import inflation risk. A weaker currency can raise the domestic cost of imported goods.
Inflation Persistence Signal
Indicates whether inflation pressures appear temporary or sticky. Persistent inflation increases the risk of tighter monetary policy.
Central Bank Monitor Indicators
Policy Rate
Shows the current short-term central bank policy stance.
Real Policy Rate
Measures whether policy is restrictive after adjusting for inflation.
Yield-Curve Slope
Shows whether market rates are above or below short-term policy rates.
Hawkish or Dovish Signal
A rule-based classification of the monetary-policy stance. Hawkish or restrictive signals appear when policy rates, real rates, or yield-curve conditions point to tight monetary conditions.
Monetary Tightness Score
Summarizes restrictive monetary-policy pressure across policy rates, real rates, and yield-curve conditions.
Fiscal Risk Monitor Indicators
Debt-to-GDP
Measures sovereign debt burden.
Fiscal Balance
Shows deficit or surplus conditions.
Nominal GDP Growth
Used to assess whether economic growth is strong enough to stabilize debt.
Debt Arithmetic
A simplified debt-sustainability indicator based on the relationship between interest rates, growth, debt, and fiscal balance.
Fiscal Stress Score
Summarizes fiscal vulnerability using debt, deficits, nominal growth, and interest-rate pressure.
Credit Cycle Dashboard Indicators
Private Credit Growth
Measures the pace of lending and credit expansion.
NPL Ratio
Tracks banking-sector asset quality.
Yield-Curve Inversion
Used as a financial-tightening and recession-risk signal.
Credit Stress Classification
Labels credit conditions as low, watch, elevated, high, or stress based on rule-based scoring.
External Vulnerability Indicators
Current Account Balance
Tracks the country’s net external position as a share of GDP.
FX Pressure
Measures exchange-rate movement and depreciation risk.
Reserve Adequacy Proxy
Captures external buffers available to absorb balance-of-payments pressure.
External Vulnerability Score
Summarizes external-sector risk using current-account conditions, FX pressure, reserves, and external-risk proxies.
Commodity and Energy Tracker Indicators
Oil
Tracks crude-oil price pressure and energy-related inflation risk.
Natural Gas
Measures broader energy-market pressure.
Copper
Serves as an industrial-cycle proxy because copper demand is often linked to construction, manufacturing, and global activity.
Food Index
Tracks food-commodity pressure and its possible impact on headline inflation.
Commodity Pass-Through
Explains how energy, food, and currency movements can feed into domestic inflation and country-risk scores.
Importer and Exporter Exposure
Identifies how commodity shocks may affect countries differently. Importers may face higher inflation when prices rise, while exporters may face downside risk when commodity prices fall.
Forecasting Lab Indicators
Moving-Average CPI Forecast
A simple baseline forecast that smooths recent CPI observations to estimate near-term inflation direction.
Linear-Trend Forecast
A basic trend-based projection that extrapolates recent indicator movement.
Last Observation Carried Forward
A simple benchmark that assumes the latest value continues forward.
Oil Shock Scenario
Tests how higher energy prices may raise inflation pressure.
Dollar Shock Scenario
Tests how exchange-rate depreciation may increase external vulnerability and import-price pressure.
Rate Shock Scenario
Tests how higher interest rates may increase monetary tightness and debt-service pressure.
Fiscal Shock Scenario
Tests how larger deficits, higher interest rates, or weaker growth may increase debt-risk pressure.
Credit Shock Scenario
Tests how tighter credit, rising stress, or deteriorating lending conditions may affect credit-cycle risk.
AI Country Report Indicators
Overall Risk Score
A country-level weighted risk score summarizing macroeconomic vulnerability.
Regime Label
A short classification of the country’s macroeconomic environment.
Confidence Indicator
A simple signal showing how strongly the available indicators support the assigned regime.
Growth Outlook
Summarizes GDP growth, labour-market conditions, and growth-momentum risk.
Inflation Outlook
Summarizes CPI, inflation pressure, wage pressure, commodity effects, and target deviation.
Labour-Market Outlook
Interprets unemployment and wage conditions alongside growth and inflation.
Monetary-Policy Outlook
Summarizes policy-rate conditions, real rates, and yield-curve signals.
Fiscal Outlook
Reviews fiscal balance, debt burden, and debt-dynamics pressure.
External Outlook
Reviews current-account conditions, FX pressure, reserves, and external vulnerability.
Key Risks
Identifies the highest risk buckets for further review, such as inflation, fiscal stress, credit stress, or external stress.
Data-Source Transparency Indicators
Source Status
Shows whether each data source is healthy, degraded, unavailable, live, demo, or fallback.
Frequency
Identifies whether the data are annual, quarterly, monthly, mixed, or demo-based.
Coverage
Shows which countries, indicators, or regions are covered by each source.
Endpoint and Series Metadata
Displays the API endpoint, series ID, unit, date, and last-updated information where available.
Live, Demo, and Fallback Labels
Clearly separates live data from demo or fallback data so users understand whether a value is official, illustrative, or unavailable.
Methodology and Risk Categories
Growth Momentum
Higher risk when GDP growth weakens, falls below trend, or unemployment rises.
Inflation Pressure
Higher risk when CPI is above target, wages accelerate, oil and food prices rise, or currency depreciation adds import-price pressure.
Monetary Tightness
Higher risk when real policy rates are positive and rising, policy is restrictive, or the yield curve is inverted.
Fiscal Stress
Higher risk when debt-to-GDP is high and rising, fiscal deficits are wide, or interest rates exceed nominal GDP growth.
Credit Stress
Higher risk when credit growth becomes unstable, non-performing loans rise, or financial conditions tighten.
External Vulnerability
Higher risk when current-account deficits are large, currencies depreciate, reserves decline, or external debt exposure rises.
The dashboard is currently an MVP and includes demo, fallback, and live-data components depending on source availability and API configuration. It is intended for academic research, teaching, portfolio demonstration, and macroeconomic decision-support design. The forecasts, classifications, and risk scores are not investment, legal, tax, or financial advice.
Research & Teaching Updates
Get research and teaching updates
Receive new economics and finance posts, Ceteris Lab module notes, dashboard updates, and applied econometrics resources when they are published.
- Macro-finance analysis
- Econometrics teaching resources
- Dashboard and project updates
Reader Feedback
Help shape future resources
Share requests for dashboard features, econometrics quiz topics, teaching resources, or research notes. This is the right place to connect future Crowdsignal polls or student feedback surveys.